Annualised Incremental Benefit
Disciplines: UX Design + UI Design + Data Analysis
Now that the digital rebrand had been completed in 2022, my task was to find what we can fine-tune and improve to help the customer complete their shopping journey on our website. I worked in a tight remit—one that required moderate code changes, touched multiple elements of the website so we could allocate the appropriate traffic, had the appropriate data points, and would not affect any work in development. Tests were either an A/B or MVT—some with iterations as I adapted to customer behaviour. Below are a highlight of the top seven successful tests and why I chose to work on them.
Checkout—Royal Mail Logo Test
HYPOTHESIS
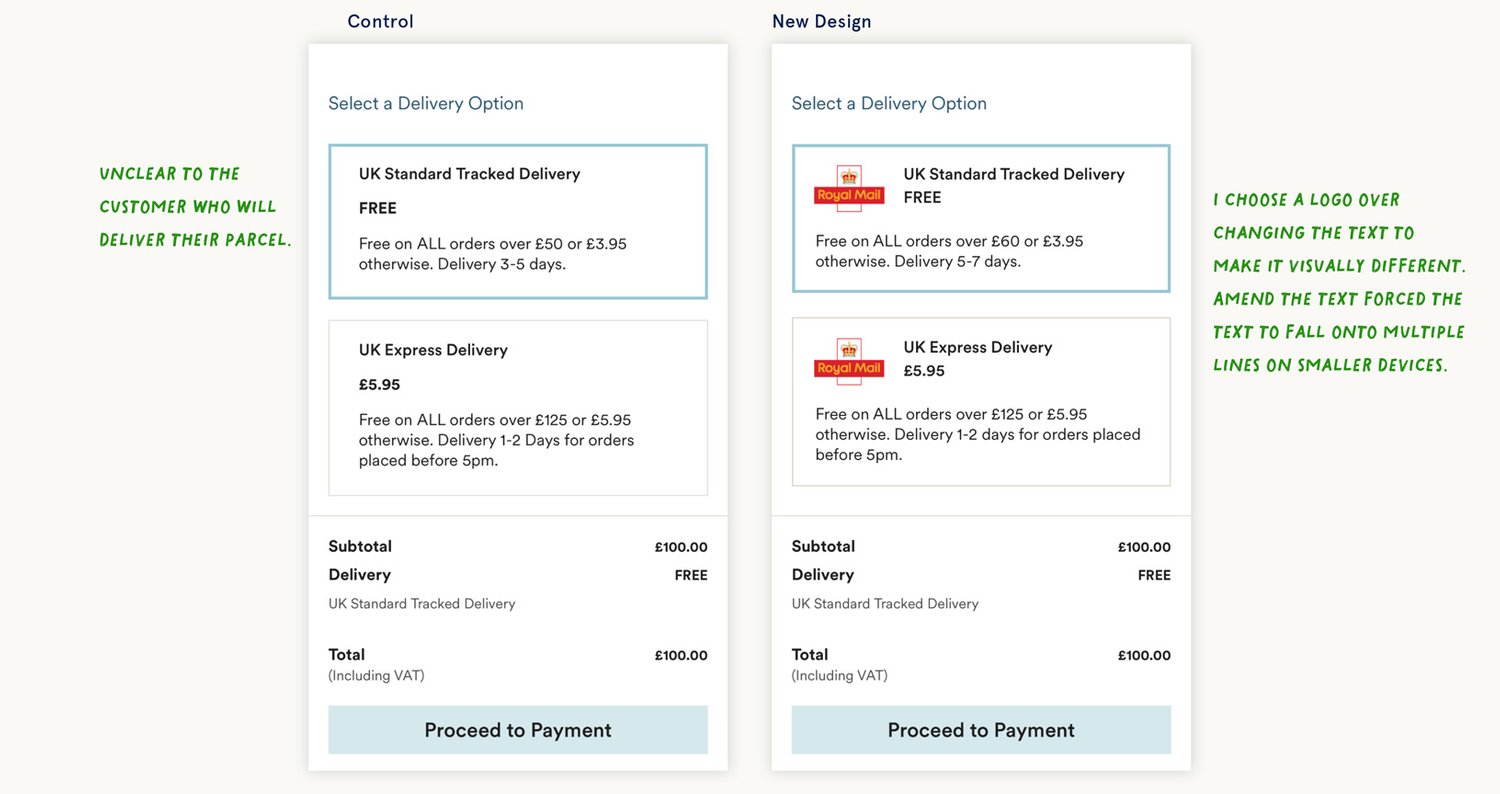
Can we build consumer confidence by displaying the Royal Mail logo on the delivery page at checkout to increase checkout conversion?
TEST TYPE
A/B
DESCRIPTION
Evri were our delivery partner and our customers had a poor experience with them. Customers were very vocal that they were not ordering with us because of our delivery partner When we changed providers, we wanted to make them aware of the change and gain the customer’s confidence in receiving their parcels with Royal Mail.
RESULTS
AOV increases +1.24% mobile and +1.04% desktop. Conversion increase of +0.5%. Small increases but with an overall improvement in brand perception.
NEXT STEPS
Test combining the delivery option with the delivery method at the start of checkout.
INCREMENTAL ANNUALISED BENEFIT
£2,180,000
Mobile Navigation Hot Spots
HYPOTHESIS
The use of visual hotspots helps improve navigation and revenue.
TEST TYPE
MVT
DESCRIPTION
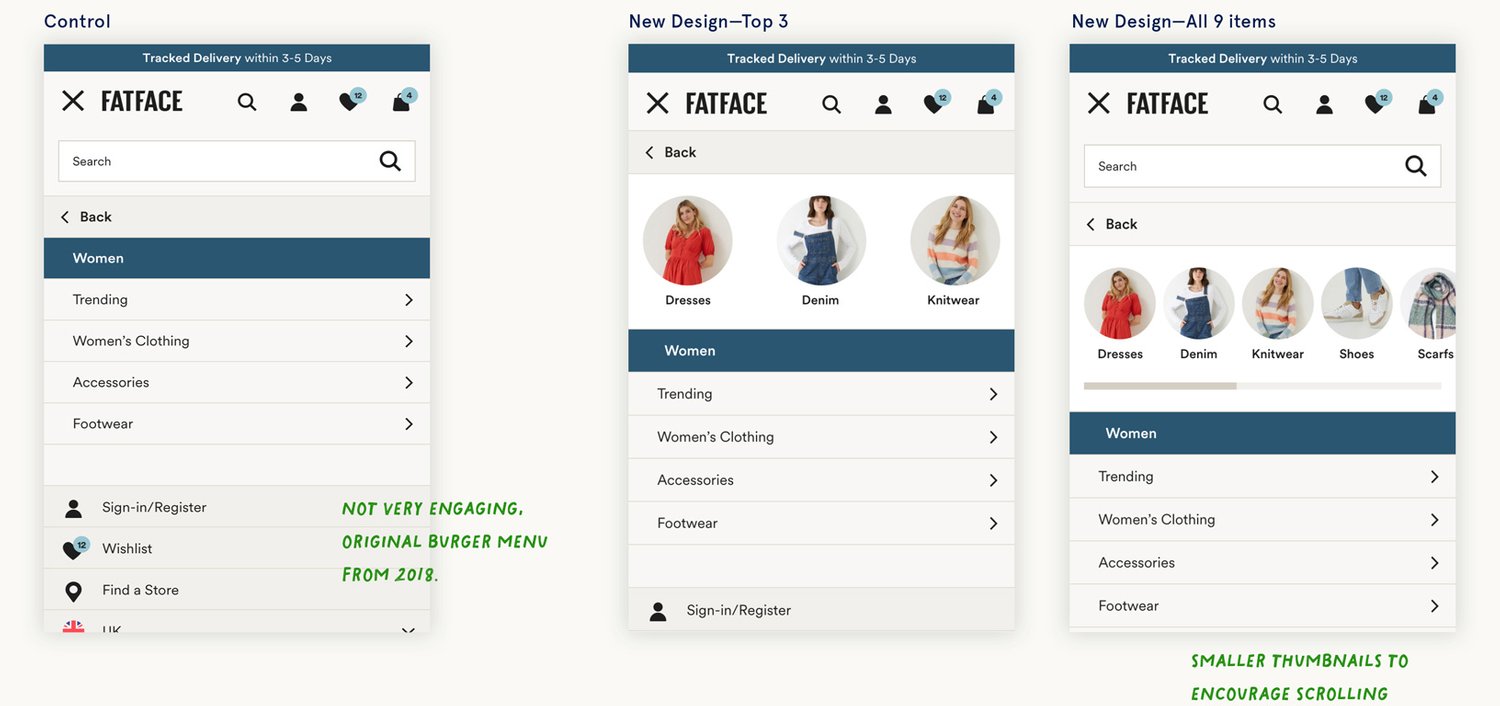
Our burger menu design takes multiple taps to get to a product category. Without diving into a complete redesign (for now), what improvements can we make so the customer can get to key categories quicker?
PIVOT
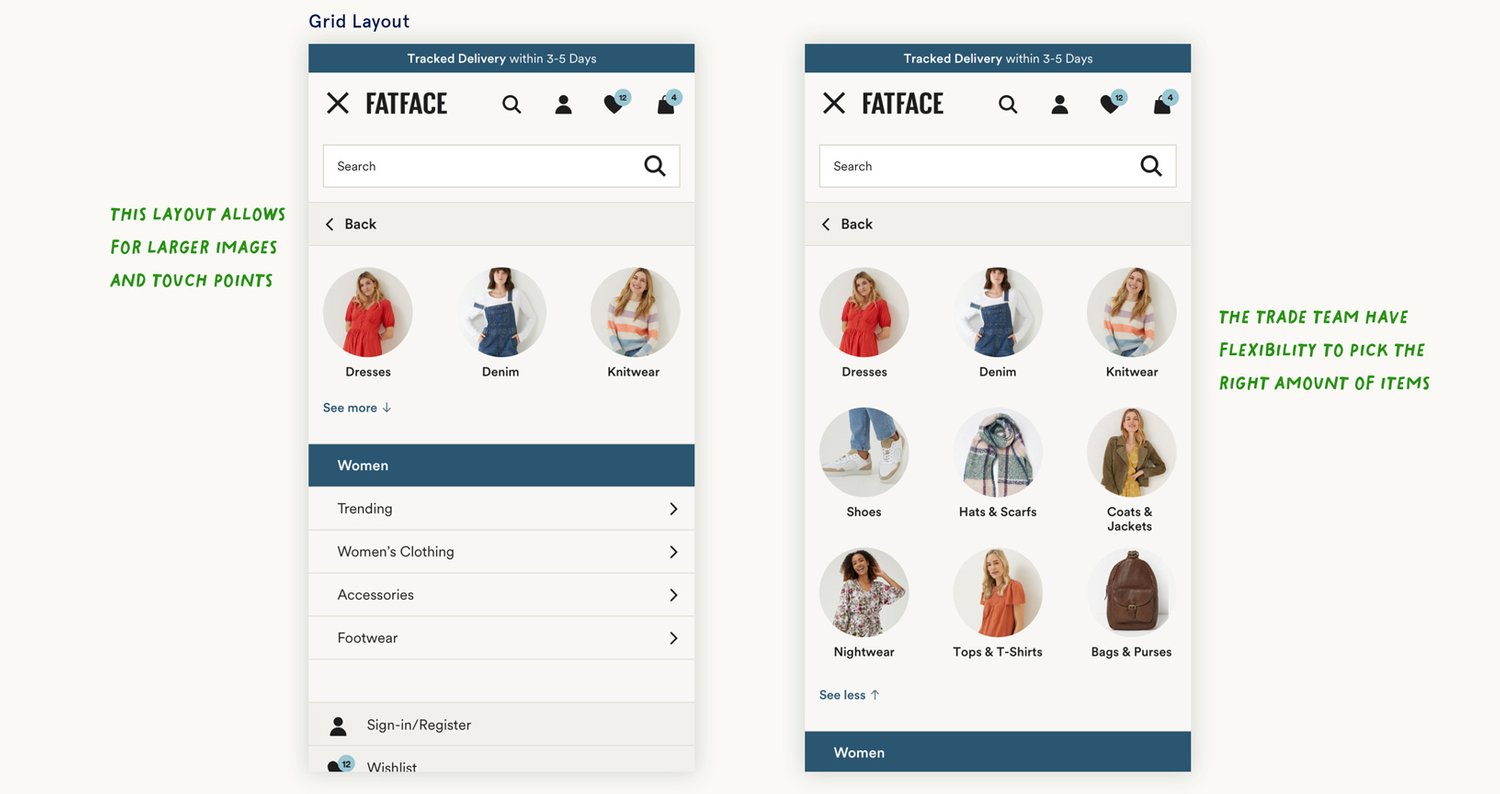
The top 3 marginally performed better than the 9 items on revenue, but the 9 items had better engagement. This led me to try another solution—changing to a grid layout rather than a horizontal scroll. This design has better flexibility between 3, 6, or 9 items.
RESULTS
High usage of +55.4% per visit, and reduced user taps by -28.2%, due to a more efficient design, and improving PDP views. ATB is up 1.9%, AOV is up +3.8%, and item quantity is up 3.5%. An unexpected outcome—search usage increased by 22% when only 3 products were shown—a possible theory the uncluttered layout gave attention to the search bar.
INCREMENTAL ANNUALISED BENEFIT
£1,840,000
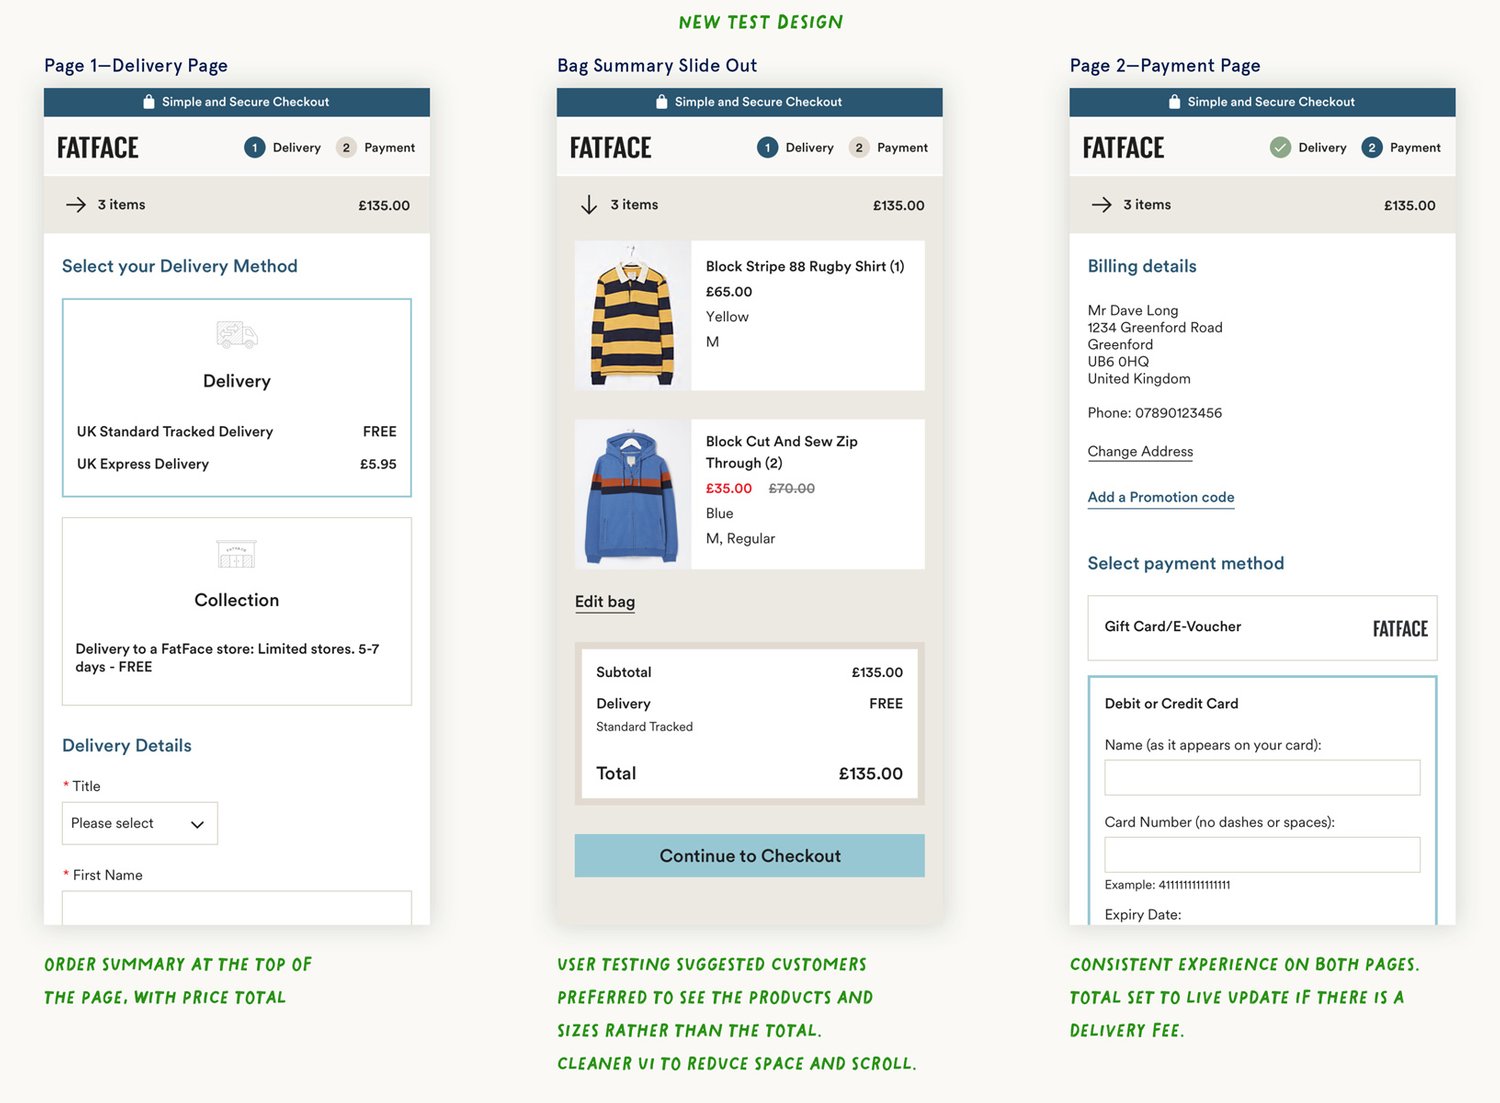
Checkout—Mobile Order Summary
HYPOTHESIS
Providing customers with a redesigned way to review their basket in the checkout increases conversion.
TEST TYPE
A/B
DESCRIPTION
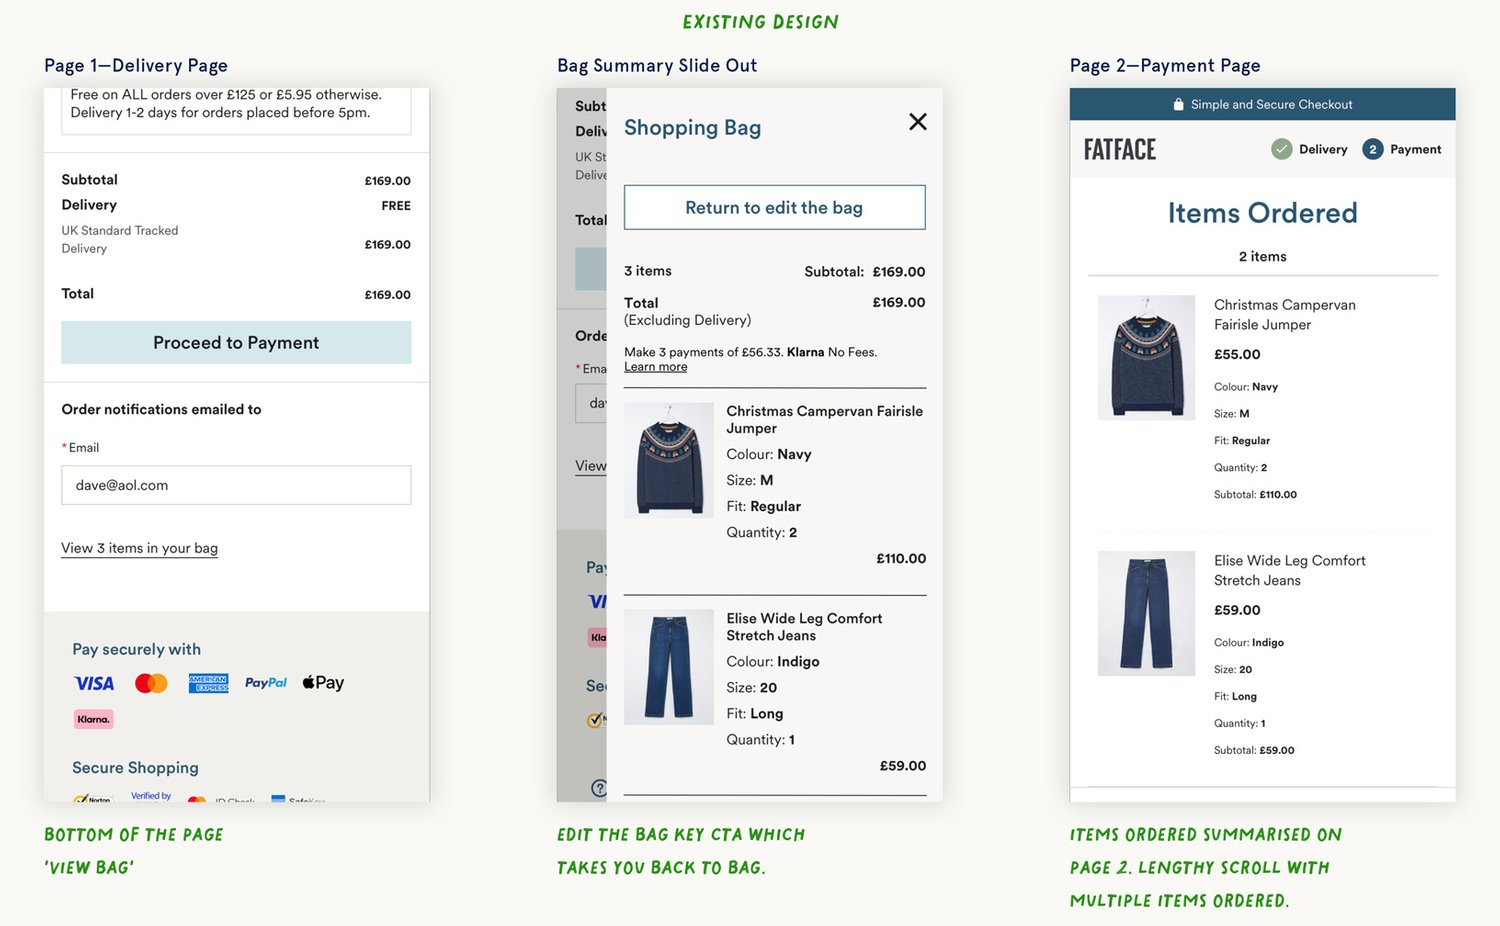
There is an inconsistent way to see items in your bag during checkout. Hidden at the bottom on page 1, and then listed out distracting you from the payment options on page 2. A solution was needed to make this consistent, cleaner and not disrupt the checkout flow.
RESULTS
Usage of +4.2% on the delivery page, while +2.7% of visits tapped the accordion at the billing stage. The percentage of those reaching the delivery page and then placing orders increased by +1.9%. The overall conversion uplift stemmed from the billing to order confirmation step—an increase of +2.2%.
NEXT STEPS
Apply/test similar changes on the desktop design.
INCREMENTAL ANNUALISED BENEFIT
£1,490,000
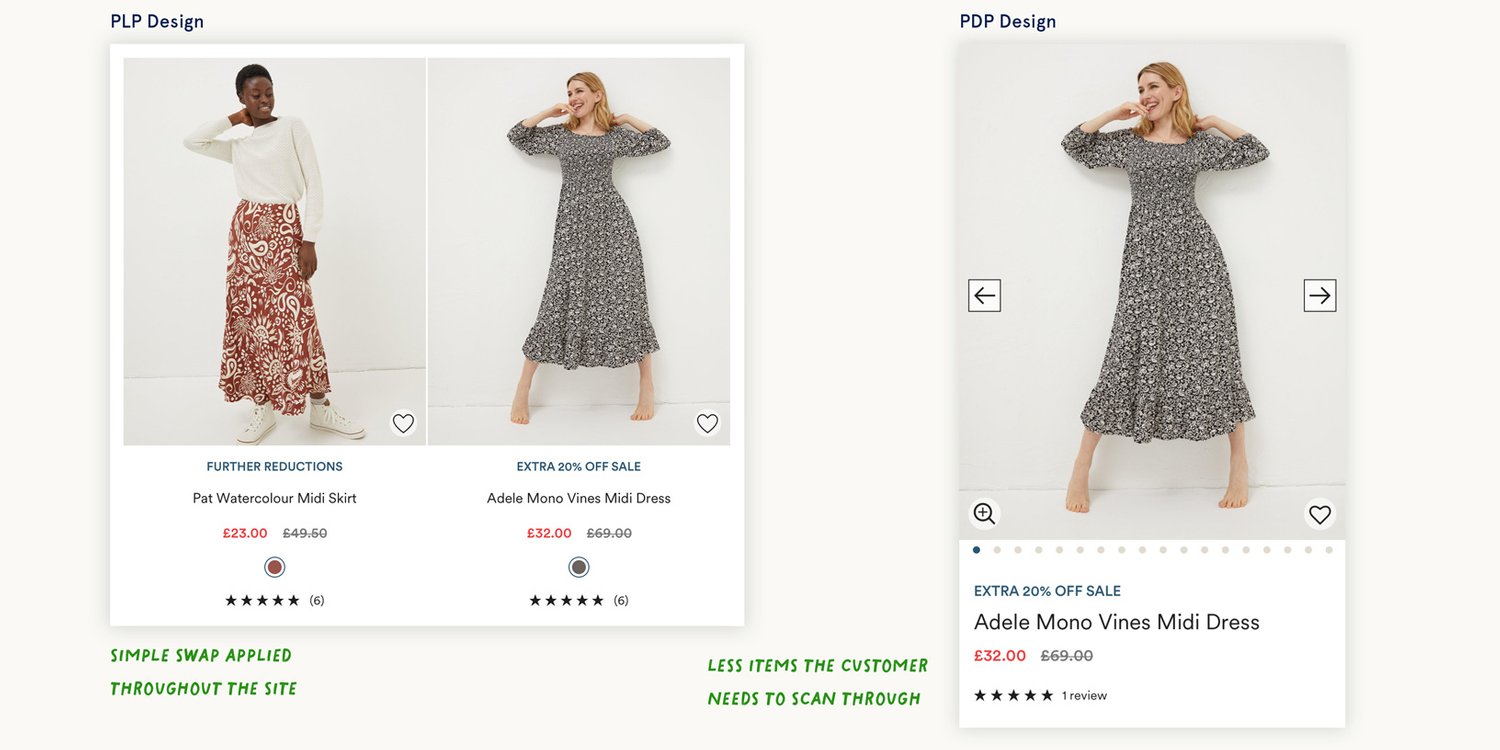
Was/Now Price Flip
HYPOTHESIS
Showing the ‘now’ price first increases conversion and revenue?
TEST TYPE
A/B
DESCRIPTION
This customer behaviour test is to fine-tune our site for optimisation—simple changes that do not require a complete redesign. We currently lead with the struck-out price, but does this increase the content the customer has to scan? The price flip was swapped throughout the funnel.
RESULTS
Increase in AOV of +4.6%. Increase in item basket quantity of +3%. This correlates with our customer being a ‘buy-now, wear-now’ behaviour, buying what they like at the price they are happy with.
NEXT STEPS
Test with percentage saving badging on PLP and PDP.
INCREMENTAL ANNUALISED BENEFIT
£1,400,000
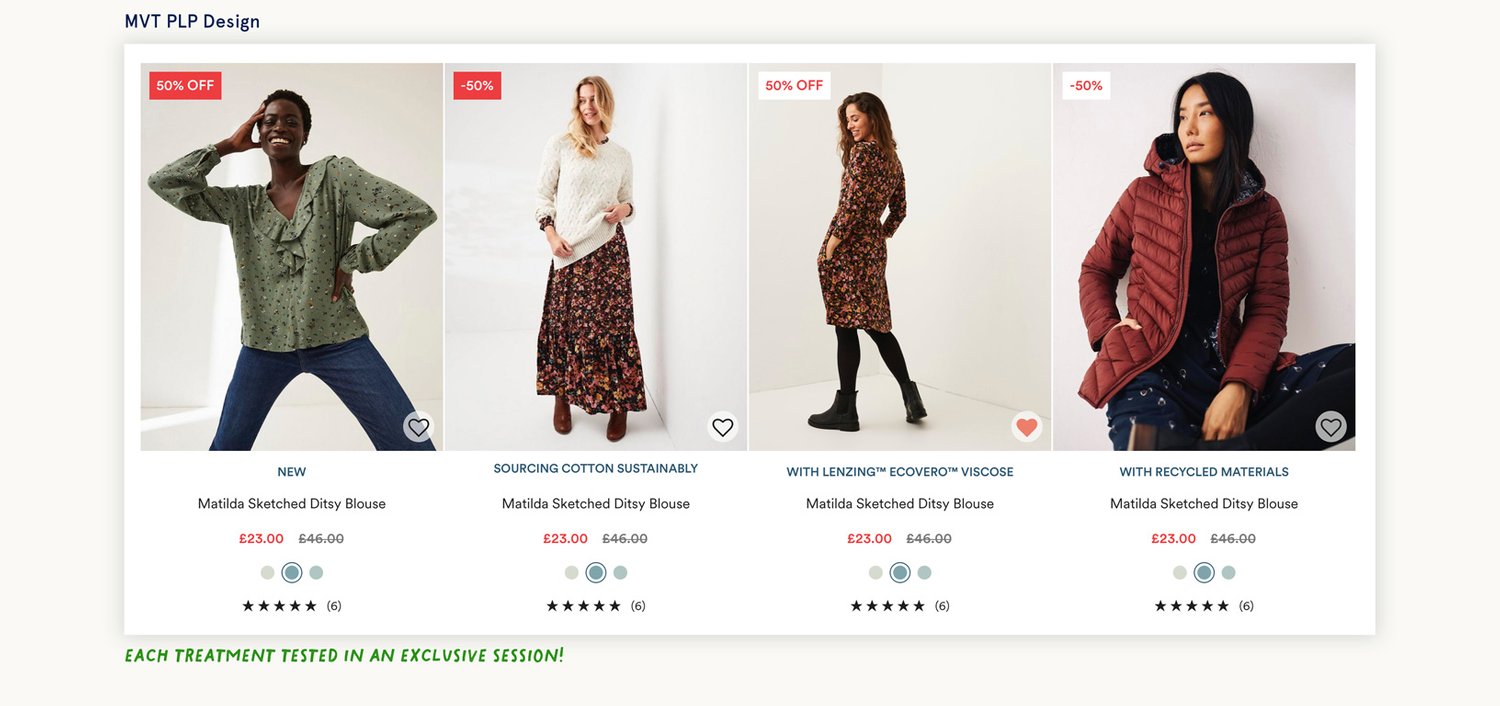
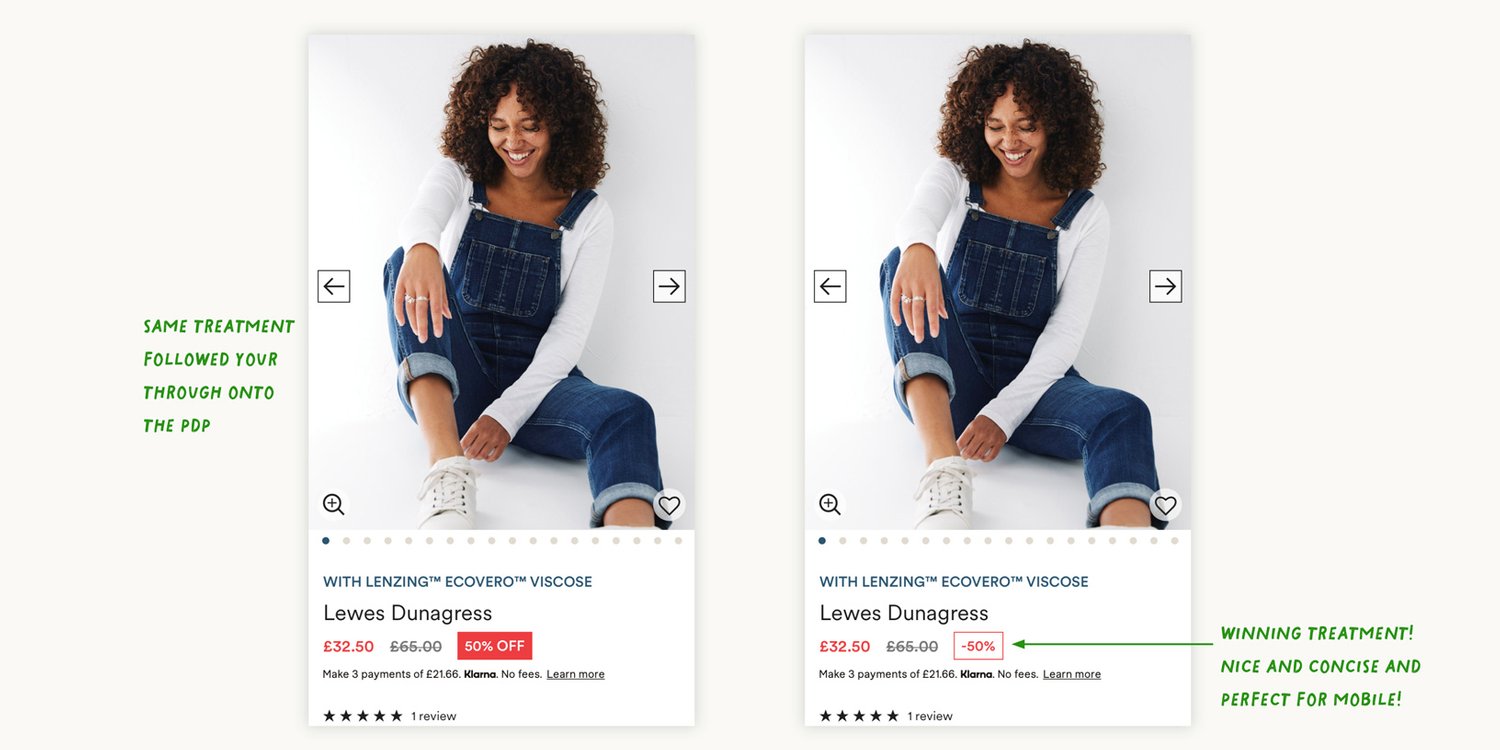
Sale Badging
HYPOTHESIS
Adding sale badging to PLP and PDP for sale products increases the number of products purchased and conversion.
TEST TYPE
MVT
DESCRIPTION
I chose to run an MVT on this occasion to find out which wording and colour treatment resonated with our customers. Previously our customers have preferred softer colours, but I wanted to test this on a sale treatment.
RESULTS
The red text on a white background performed the best with direct wording of ‘-50%’. Increase in conversion +5.4%. Increase of AOV by +6.3%.
NEXT STEPS
Testing this further down the funnel on the shopping bag and checkout. Create an updated design for seasonal promotions and ‘3 for 2’ offers.
INCREMENTAL ANNUALISED BENEFIT
£1,390,000
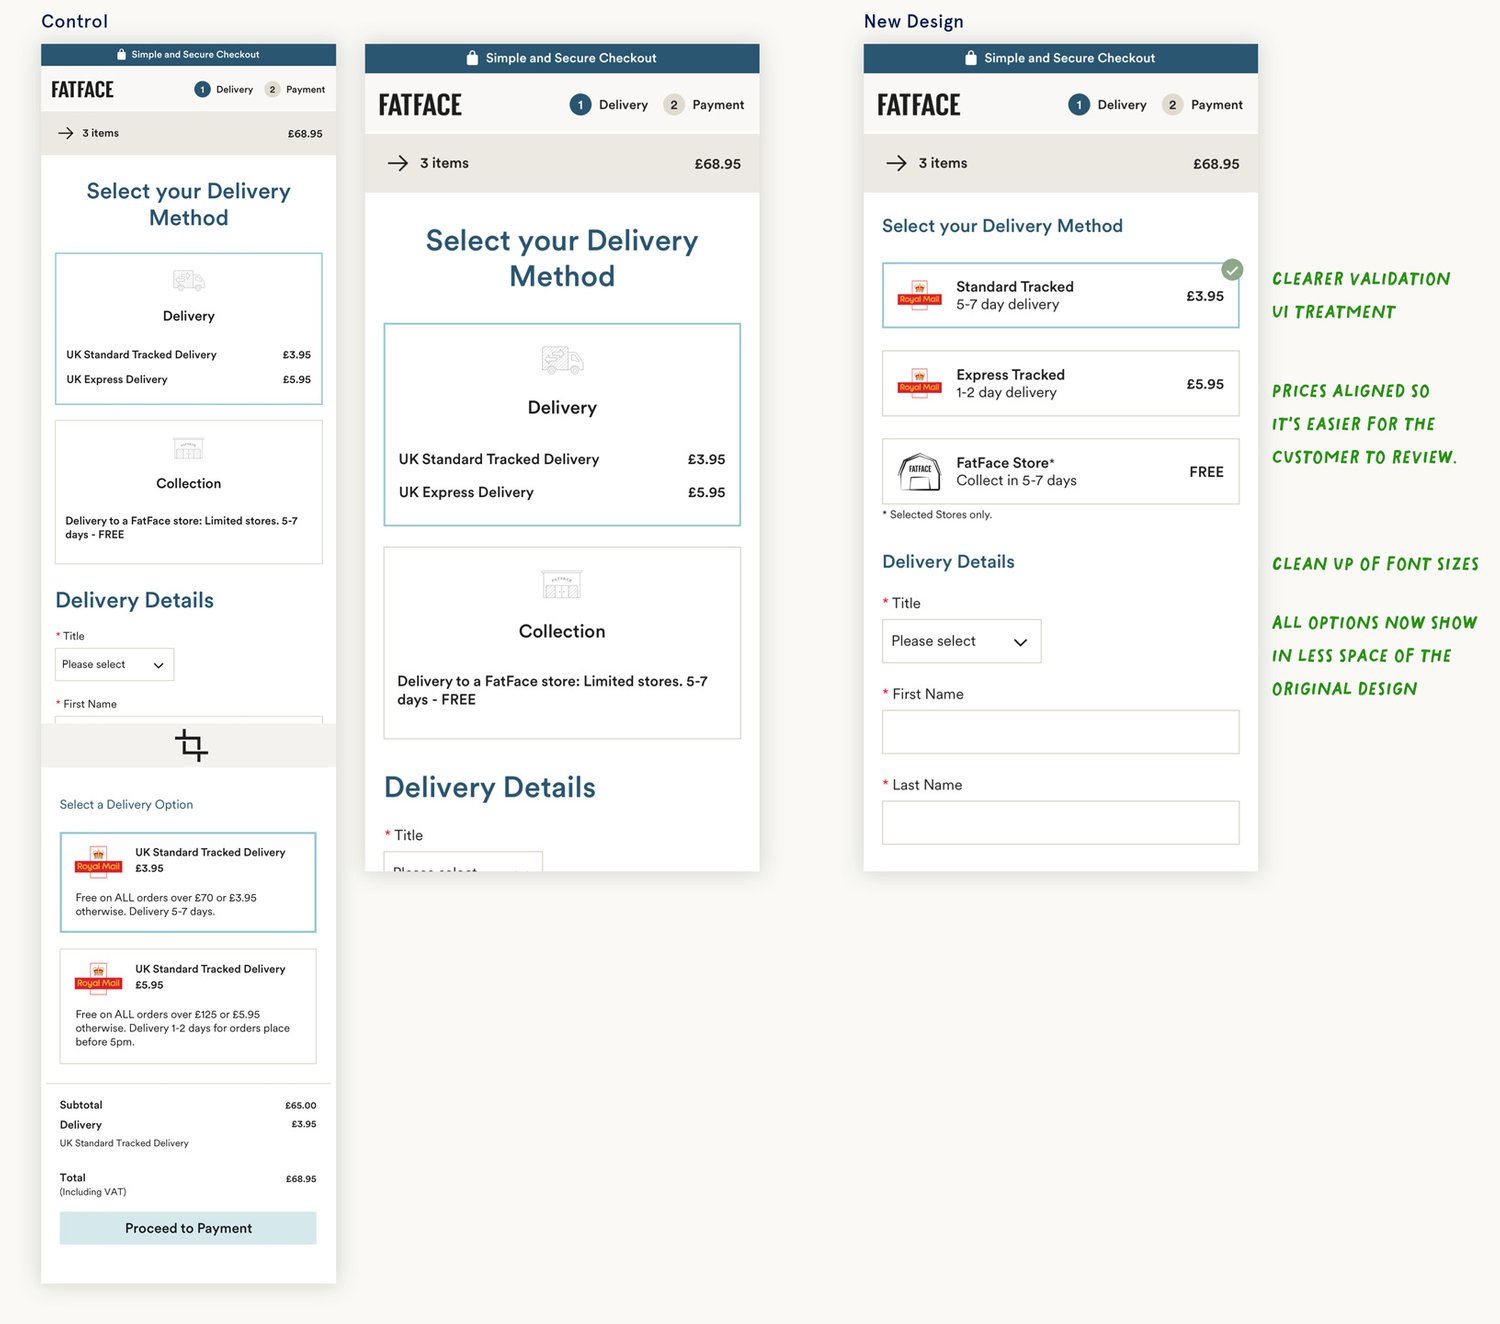
Checkout—Combining Delivery Options
HYPOTHESIS
Combining the delivery options at the same stage where the customer chooses the delivery method will streamline the checkout process and drive conversion.
TEST TYPE
A/B
DESCRIPTION
Delivery options are listed but are not selectable until later into the checkout flow—the previous delivery provider not offering express to all locations. Customers can now select their delivery method and speed in the same decision step. Updating the UI to make it clearer which option is selected and reducing the scroll depth to complete actions.
RESULTS
Conversion from delivery page to payment page increased but +1%. Uplift in customers choosing to use the Express delivery option by +4.3%. Showing all delivery options visible at the top of the page has further helped the conversion rate and allowed customers to review all options at the same time.
NEXT STEPS
Optimise the text to find the sweet spot where customers feel confident to continue.
INCREMENTAL ANNUALISED BENEFIT
£1,000,000
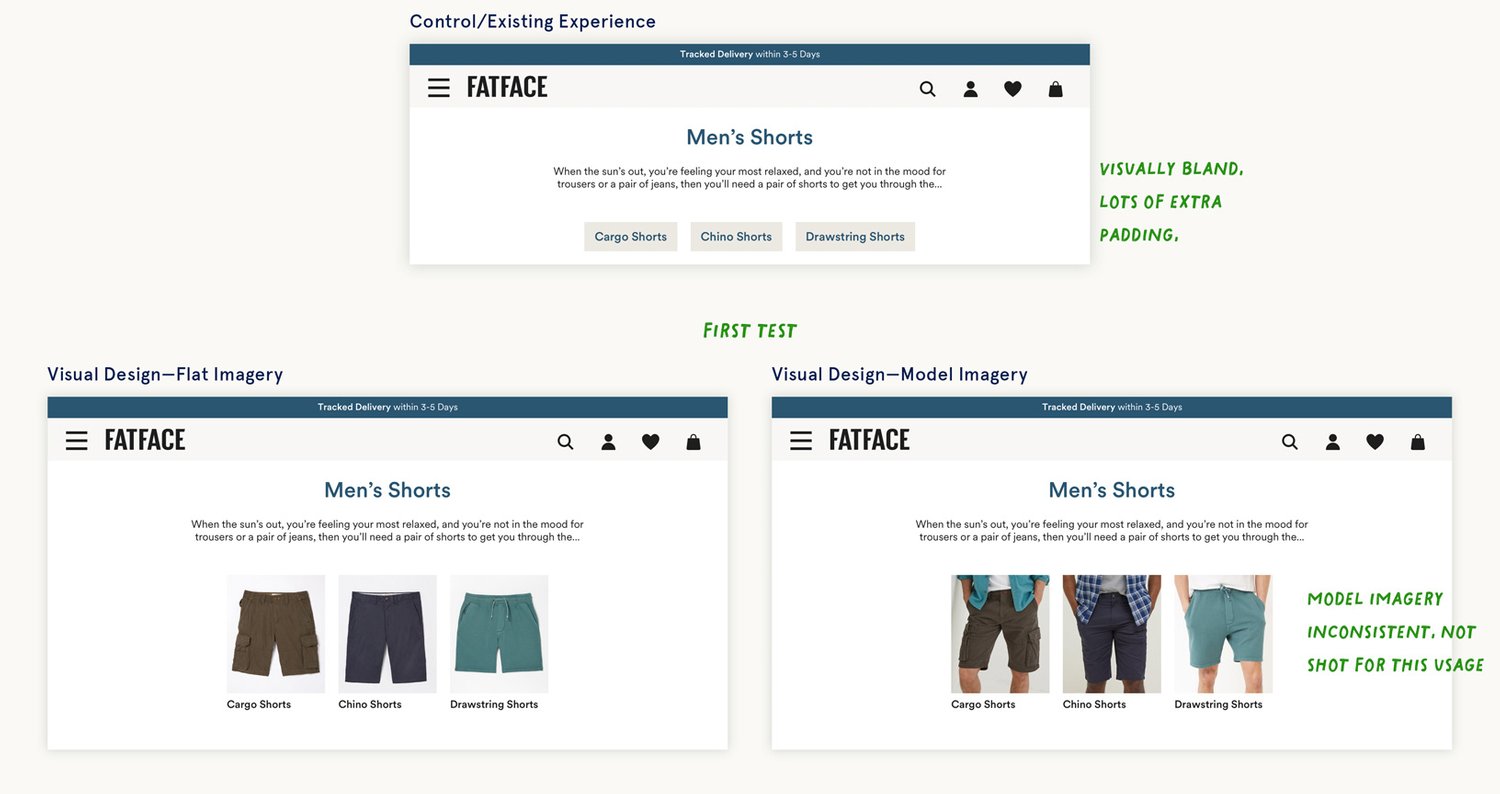
Visual Quick Links
HYPOTHESIS
Visualising Quick-Links to see if they increase revenue and PDP views.
TEST TYPE
MVT
DESCRIPTION
The first step was to test if visual quick-links have better interaction than the control. We’ve had mixed results in Women’s Dresses, so we’re expanding the test to see if we can gain consistent data to inform our direction.
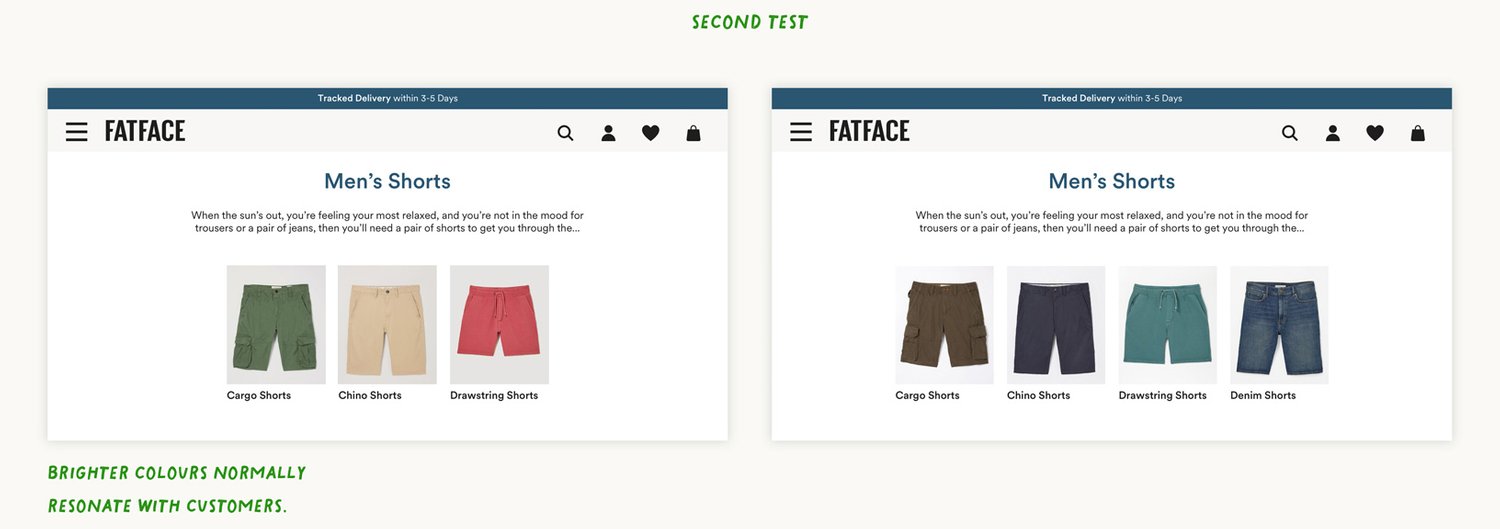
RESULTS
Mixed results, while all options gained usage between +4-11%, brighter colours increased PDP visits by +3.1% but did not translate into an increase in the ATB rate. While 4 options, saw a decrease of -3% in PDP visits, but with an increase of +5% in ATB rate. This led to a revenue increase of +10% overall.
NEXT STEPS
Test on other categories to see if learnings are consistent with our customers.
INCREMENTAL ANNUALISED BENEFIT
£518,000
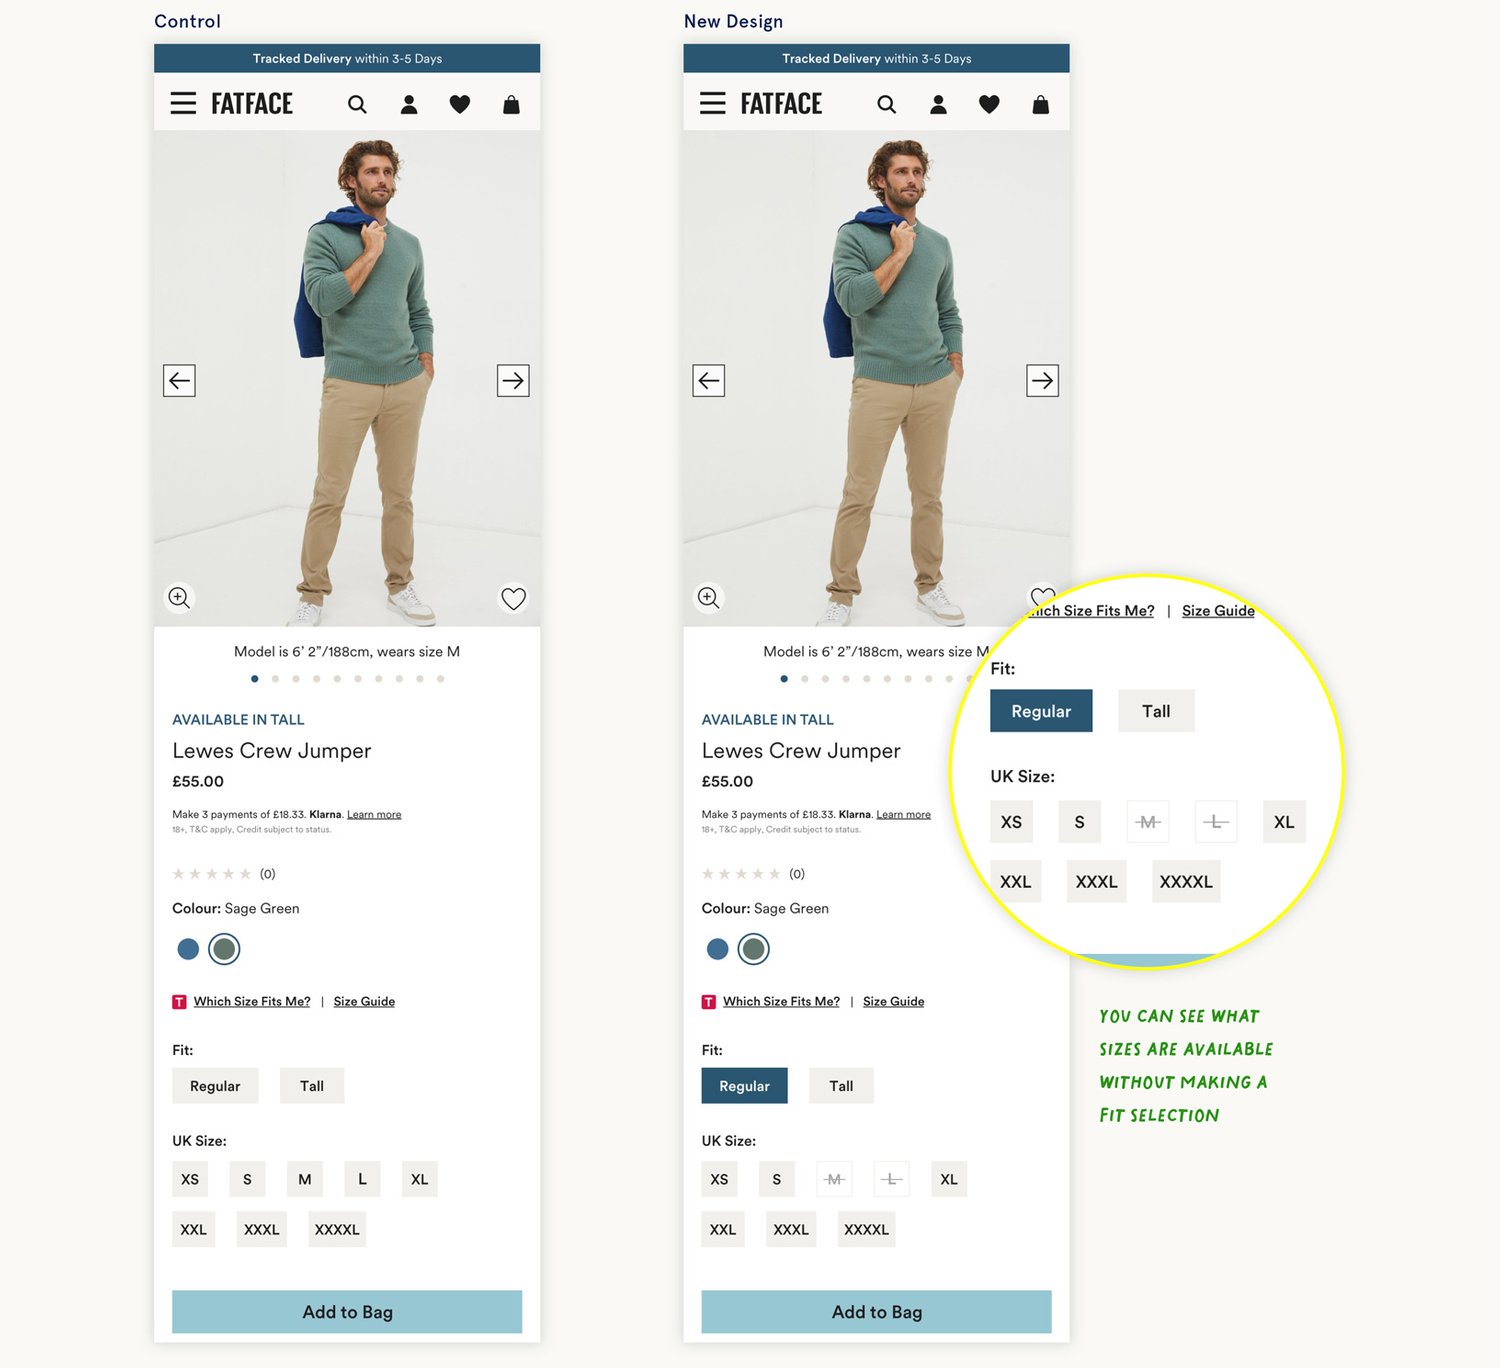
'Regualr' Fit Pre-selected
HYPOTHESIS
Pre-selecting regular fits on PDP increased conversion?
TEST TYPE
A/B
DESCRIPTION
We have a different UI treatment for in-stock and out-of-stock sizes. Customers are misled on the sizes available as it currently loads a collective total than per fit. Having ‘Regular’ preselected removes a step for the customer and allows them to see a true reflection of the sizes available on the page load. It also eliminates a selection customers may have
to make.
RESULTS
Uplift in ATB of +3%, +6.8% increase in wishlist addition. +2.8% increase in the customer reaching the order confirmation page. Full funnel improvements by being upfront with the customer and removing ambiguity. Decrease usage in TrueFit and Size Guide—could lead to more returns?
INCREMENTAL ANNUALISED BENEFIT
£360,000
© MMXXIV PARCA
